Note
Go to the end to download the full example code.
Hiding Individual Neurons#
By default, graph_view draws a fully-connected mesh between every pair of adjacent layers’
neuron circles. That’s accurate for a genuinely dense layer (e.g. Linear), but misleading for a
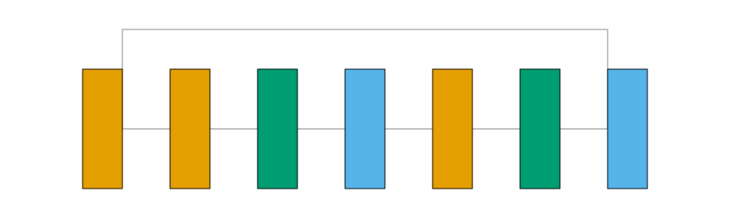
convolutional one - a Conv2d’s real connectivity is local and shared across spatial positions,
not “every input channel wired to every output channel.” Setting show_neurons=False draws
each layer as a single box instead, which is the more honest representation for a conv-heavy
model.
The model used here is a classic ResNet-style residual block (Conv2d + BatchNorm2d, twice, with a plain identity shortcut and a final ReLU) - conv-heavy and branching, a good stress test for both this setting and graph_view’s skip-connection routing. Conv2d is orange, BatchNorm2d is green, and ReLU is sky blue.
from collections import defaultdict

import matplotlib.pyplot as plt
import torch
import visualtorch
from torch import nn


class ResidualBlock(nn.Module):
    """A classic ResNet-style block with a plain identity shortcut."""

    def __init__(self, channels: int) -> None:
        super().__init__()
        self.conv1 = nn.Conv2d(channels, channels, kernel_size=3, padding=1)
        self.bn1 = nn.BatchNorm2d(channels)
        self.relu = nn.ReLU()
        self.conv2 = nn.Conv2d(channels, channels, kernel_size=3, padding=1)
        self.bn2 = nn.BatchNorm2d(channels)

    def forward(self, x: torch.Tensor) -> torch.Tensor:
        """Define the forward pass, with a skip connection around conv1/bn1/relu/conv2/bn2."""
        identity = x
        out = self.relu(self.bn1(self.conv1(x)))
        out = self.bn2(self.conv2(out))
        out = out + identity
        return self.relu(out)


model = ResidualBlock(channels=8)

input_shape = (1, 8, 16, 16)

color_map: dict = defaultdict(dict)
color_map[nn.Conv2d]["fill"] = "#E69F00"
color_map[nn.BatchNorm2d]["fill"] = "#009E73"
color_map[nn.ReLU]["fill"] = "#56B4E9"

img = visualtorch.render(model, input_shape, style="graph", show_neurons=False, color_map=color_map, layer_spacing=60)

dpi = 150  # rendered at 2x this in the final doc build (savefig.dpi=300 in conf.py)
plt.figure(figsize=(img.width / dpi, img.height / dpi), dpi=dpi)
plt.imshow(img)
plt.axis("off")
plt.tight_layout()
plt.show()