

Note
Go to the end to download the full example code.
Hide Neurons#
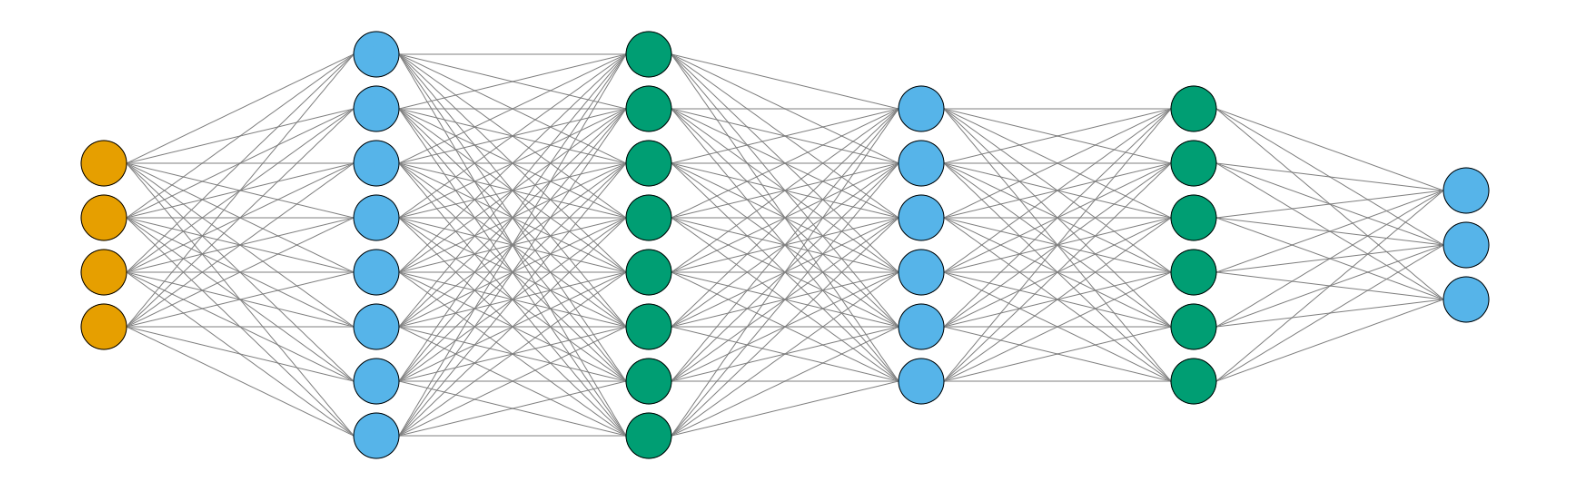
By default graph_view draws one node per neuron (constrained by ellipsize_after), which is
great for seeing the width of each layer but gets busy for anything beyond a toy model. Setting
show_neurons=False collapses each layer down to a single node, giving a much more compact,
block-diagram-like view that stays readable for deeper networks.
The two renders below use the same model so the difference is easy to spot.
import matplotlib.pyplot as plt
import visualtorch
from torch import nn

model = nn.Sequential(
    nn.Linear(4, 8),
    nn.ReLU(),
    nn.Linear(8, 6),
    nn.ReLU(),
    nn.Linear(6, 3),
)

input_shape = (1, 4)

dpi = 150  # rendered at 2x this in the final doc build (savefig.dpi=300 in conf.py)


def _show(*, show_neurons: bool) -> None:
    img = visualtorch.render(model, input_shape, style="graph", show_neurons=show_neurons)
    plt.figure(figsize=(img.width / dpi, img.height / dpi), dpi=dpi)
    plt.imshow(img)
    plt.axis("off")
    plt.tight_layout()
    plt.show()
show_neurons=True (default)#
One node per neuron - the width of every layer is visible at a glance.
_show(show_neurons=True)
show_neurons=False#
One node per layer - a compact view that scales to deeper models without the clutter.
_show(show_neurons=False)
