

Note
Go to the end to download the full example code.
Outline Width#
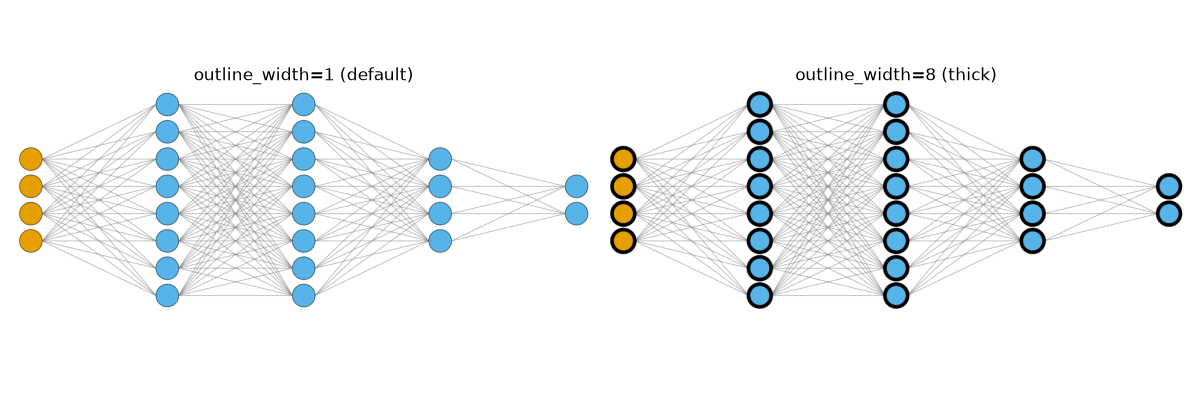
Visualization of thin vs thick outline border using the outline_width parameter
in the graph style.
import matplotlib.pyplot as plt
import torch
import visualtorch
from torch import nn


class SimpleDense(nn.Module):
    """Simple Dense Model."""

    def __init__(self) -> None:
        super().__init__()
        self.h0 = nn.Linear(4, 8)
        self.h1 = nn.Linear(8, 8)
        self.h2 = nn.Linear(8, 4)
        self.out = nn.Linear(4, 2)

    def forward(self, x: torch.Tensor) -> torch.Tensor:
        """Define the forward pass."""
        x = self.h0(x)
        x = self.h1(x)
        x = self.h2(x)
        return self.out(x)


model = SimpleDense()
input_shape = (1, 4)


fig, axes = plt.subplots(1, 2, figsize=(12, 4))

img_thin = visualtorch.render(model, input_shape=input_shape, style="graph", outline_width=1)
axes[0].imshow(img_thin)
axes[0].axis("off")
axes[0].set_title("outline_width=1 (default)")

img_thick = visualtorch.render(model, input_shape=input_shape, style="graph", outline_width=8)
axes[1].imshow(img_thick)
axes[1].axis("off")
axes[1].set_title("outline_width=8 (thick)")

plt.tight_layout()
plt.show()