Note
Go to the end to download the full example code.
Legend Position#
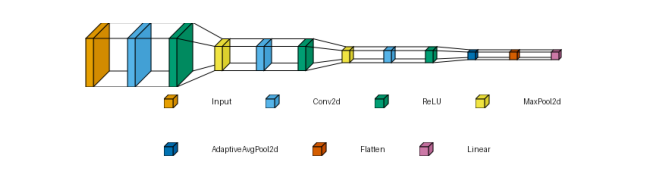
Place the flow legend above or below the diagram, aligned left, center, or right.
import matplotlib.pyplot as plt
import visualtorch
from torch import nn

model = nn.Sequential(
    nn.Conv2d(3, 16, kernel_size=3, padding=1),
    nn.ReLU(),
    nn.MaxPool2d(2, 2),
    nn.Conv2d(16, 32, kernel_size=3, padding=1),
    nn.ReLU(),
    nn.MaxPool2d(2, 2),
    nn.Conv2d(32, 64, kernel_size=3, padding=1),
    nn.ReLU(),
    nn.AdaptiveAvgPool2d((1, 1)),
    nn.Flatten(),
    nn.Linear(64, 10),
)

input_shape = (1, 3, 64, 64)
dpi = 150  # rendered at 2x this in the final doc build (savefig.dpi=300 in conf.py)


def _show(position: str) -> None:
    img = visualtorch.render(
        model,
        input_shape=input_shape,
        style="flow",
        legend=True,
        legend_position=position,
        spacing=45,
    )
    plt.figure(figsize=(img.width / dpi, img.height / dpi), dpi=dpi)
    plt.imshow(img)
    plt.axis("off")
    plt.tight_layout()
    plt.show()
Top-left#
_show("top-left")
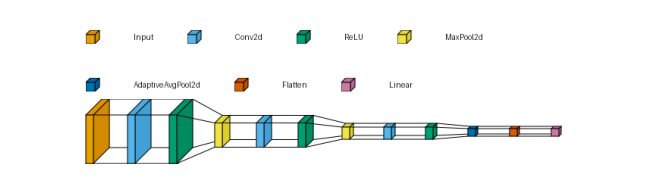
Top-center#
_show("top-center")
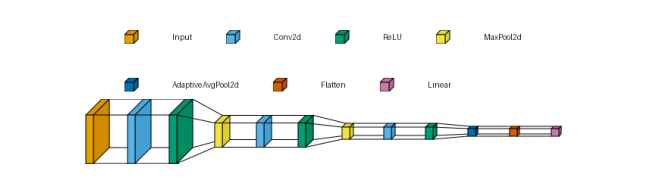
Bottom-right#
_show("bottom-right")