Note
Go to the end to download the full example code.
Higher Resolution#
By default, graph_view’s node/box size is fairly small - fine for a quick look, but often too
small once you want a crisp, presentation- or paper-quality image. The main lever is
node_size (in pixels, applies whether you’re using show_neurons=True circles or
show_neurons=False boxes), paired with layer_spacing/node_spacing so a bigger node
size still has enough room around it. See also the Custom Node Size example for a more
focused look at node_size alone.
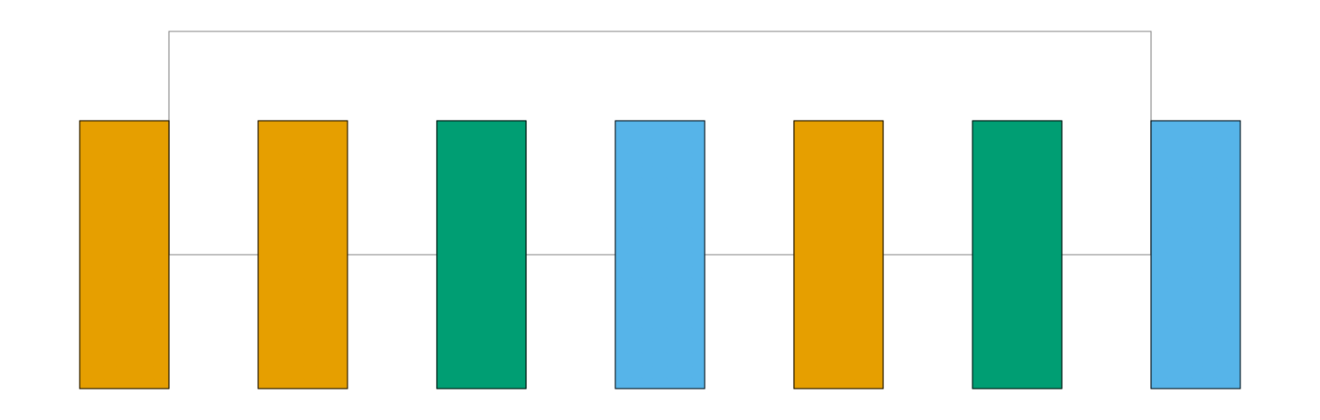
Conv2d is orange, BatchNorm2d is green, and ReLU is sky blue.
from collections import defaultdict

import matplotlib.pyplot as plt
import torch
import visualtorch
from torch import nn


class ResidualBlock(nn.Module):
    """A classic ResNet-style block with a plain identity shortcut."""

    def __init__(self, channels: int) -> None:
        super().__init__()
        self.conv1 = nn.Conv2d(channels, channels, kernel_size=3, padding=1)
        self.bn1 = nn.BatchNorm2d(channels)
        self.relu = nn.ReLU()
        self.conv2 = nn.Conv2d(channels, channels, kernel_size=3, padding=1)
        self.bn2 = nn.BatchNorm2d(channels)

    def forward(self, x: torch.Tensor) -> torch.Tensor:
        """Define the forward pass, with a skip connection around conv1/bn1/relu/conv2/bn2."""
        identity = x
        out = self.relu(self.bn1(self.conv1(x)))
        out = self.bn2(self.conv2(out))
        out = out + identity
        return self.relu(out)


model = ResidualBlock(channels=8)

input_shape = (1, 8, 16, 16)

color_map: dict = defaultdict(dict)
color_map[nn.Conv2d]["fill"] = "#E69F00"
color_map[nn.BatchNorm2d]["fill"] = "#009E73"
color_map[nn.ReLU]["fill"] = "#56B4E9"

dpi = 150  # rendered at 2x this in the final doc build (savefig.dpi=300 in conf.py)
Default#
At the default node_size (50) and layer_spacing (250), boxes are small.
img_default = visualtorch.render(model, input_shape, style="graph", show_neurons=False, color_map=color_map)

plt.figure(figsize=(img_default.width / dpi, img_default.height / dpi), dpi=dpi)
plt.imshow(img_default)
plt.axis("off")
plt.tight_layout()
plt.show()

Higher Resolution#
Raising node_size and layer_spacing gives a much more substantial, presentation-ready
result.
img_hires = visualtorch.render(
    model,
    input_shape,
    style="graph",
    show_neurons=False,
    color_map=color_map,
    node_size=100,
    layer_spacing=100,
)

plt.figure(figsize=(img_hires.width / dpi, img_hires.height / dpi), dpi=dpi)
plt.imshow(img_hires)
plt.axis("off")
plt.tight_layout()
plt.show()