Note
Go to the end to download the full example code.
Color Palettes#
Instead of hand-building a color_map entry for every layer type, pick a named palette -
it’s used as the fallback fill color for any layer type not given an explicit color_map
override. A handful of the built-in palettes are shown below; see visualtorch.PALETTES.keys()
for the full list.
import matplotlib.pyplot as plt
import visualtorch
from torch import nn

model = nn.Sequential(
    nn.Conv2d(3, 16, kernel_size=3, padding=1),
    nn.ReLU(),
    nn.MaxPool2d(2, 2),
    nn.Conv2d(16, 32, kernel_size=3, padding=1),
    nn.ReLU(),
    nn.Flatten(),
    nn.Linear(32 * 112 * 112, 10),
)

input_shape = (1, 3, 224, 224)

dpi = 150  # rendered at 2x this in the final doc build (savefig.dpi=300 in conf.py)


def _show(palette: str) -> None:
    img = visualtorch.render(model, input_shape, style="flow", palette=palette)
    plt.figure(figsize=(img.width / dpi, img.height / dpi), dpi=dpi)
    plt.imshow(img)
    plt.axis("off")
    plt.tight_layout()
    plt.show()
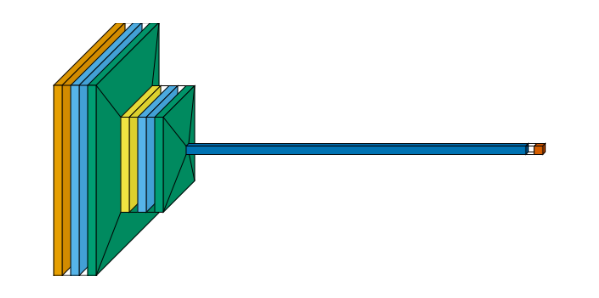
Okabe-Ito#
Colorblind-safe, widely recommended for scientific visualization - this is the default.
_show("okabe_ito")
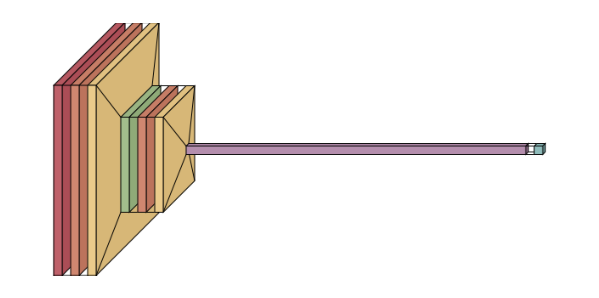
Nord#
Cool, arctic-toned - a popular editor/terminal theme.
_show("nord")
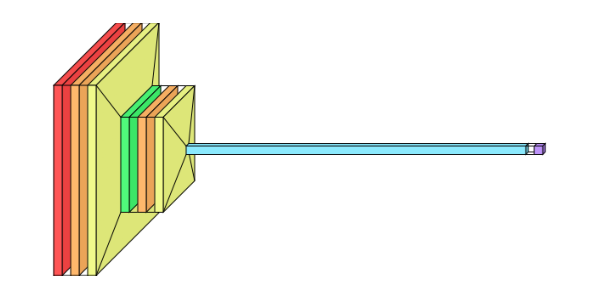
Dracula#
High-contrast purple/pink/green/cyan - punchy and playful.
_show("dracula")
Catppuccin#
Soft pastel-but-vibrant - the current darling of the dev-theme world.
_show("catppuccin")

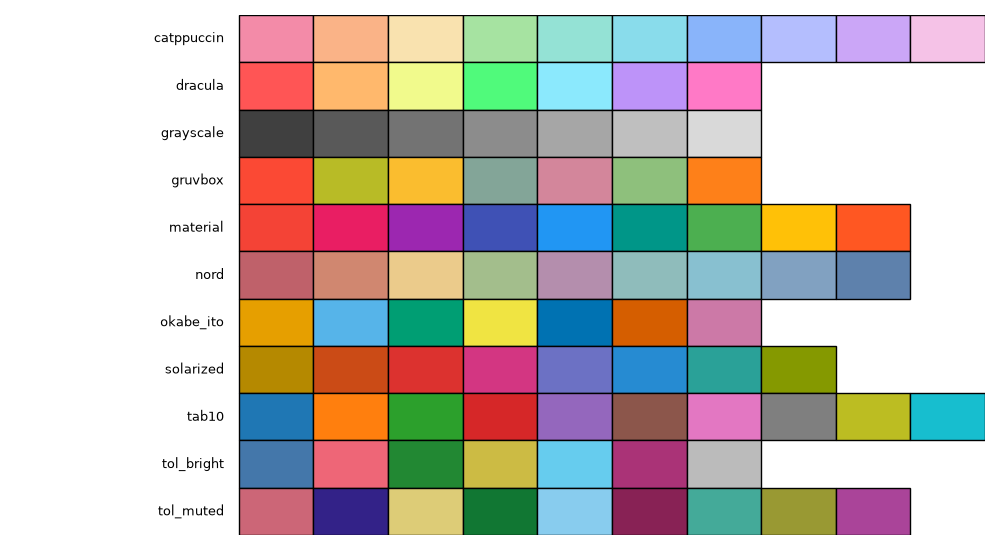
All Palettes at a Glance#
Every built-in palette’s colors, for quick reference.
names = sorted(visualtorch.PALETTES)
max_colors = max(len(colors) for colors in visualtorch.PALETTES.values())

fig, ax = plt.subplots(figsize=(max_colors, len(names) * 0.5))
for row, name in enumerate(names):
    for col, color in enumerate(visualtorch.PALETTES[name]):
        ax.add_patch(plt.Rectangle((col, len(names) - row - 1), 1, 1, facecolor=color, edgecolor="black"))
    ax.text(-0.2, len(names) - row - 0.5, name, ha="right", va="center", fontsize=9)

ax.set_xlim(-3, max_colors)
ax.set_ylim(0, len(names))
ax.axis("off")
plt.tight_layout()
plt.show()