
Note
Go to the end to download the full example code.
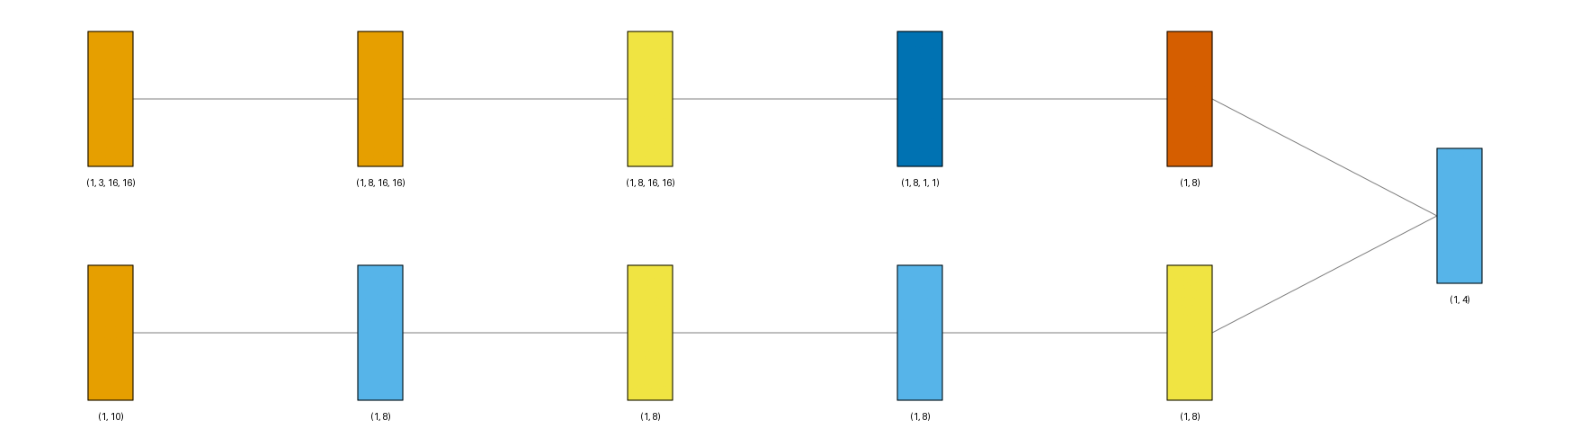
Multi-Input Model (Siamese-style)#
Visualization of a model whose forward() takes two separate input tensors instead of one -
an image branch (Conv2d + global pooling) and a tabular-vector branch (a small MLP) - merged by
concatenation before a shared head. This is the pattern used by siamese networks and multi-modal
architectures.
Pass a tuple of per-tensor shapes as input_shape instead of a single flat shape - one shape
per positional argument of forward(), in order. Each input gets its own box at the start of
the diagram (with show_dimension=True here, its shape is printed underneath).
Conv2d is orange and Linear is sky blue.
from collections import defaultdict

import matplotlib.pyplot as plt
import torch
import visualtorch
from torch import nn


class SiameseNet(nn.Module):
    """A two-branch model: an image branch and a tabular-vector branch, merged by concatenation."""

    def __init__(self) -> None:
        super().__init__()
        self.image_branch = nn.Sequential(
            nn.Conv2d(3, 8, kernel_size=3, stride=1, padding=1),
            nn.ReLU(),
            nn.AdaptiveAvgPool2d(1),
            nn.Flatten(),
        )
        self.vector_branch = nn.Sequential(
            nn.Linear(10, 8),
            nn.ReLU(),
            nn.Linear(8, 8),
            nn.ReLU(),
        )
        self.head = nn.Linear(16, 4)

    def forward(self, image: torch.Tensor, vector: torch.Tensor) -> torch.Tensor:
        """Run each branch on its own input tensor, then concatenate and project."""
        image_features = self.image_branch(image)
        vector_features = self.vector_branch(vector)
        merged = torch.cat([image_features, vector_features], dim=1)
        return self.head(merged)


model = SiameseNet()

# One shape per forward() argument: (image, vector).
input_shape = ((1, 3, 16, 16), (1, 10))

color_map: dict = defaultdict(dict)
color_map[nn.Conv2d]["fill"] = "#E69F00"
color_map[nn.Linear]["fill"] = "#56B4E9"

img = visualtorch.render(
    model,
    input_shape,
    style="graph",
    show_neurons=False,
    color_map=color_map,
    show_dimension=True,
)

dpi = 150  # rendered at 2x this in the final doc build (savefig.dpi=300 in conf.py)
plt.figure(figsize=(img.width / dpi, img.height / dpi), dpi=dpi)
plt.imshow(img)
plt.axis("off")
plt.tight_layout()
plt.show()