
Note
Go to the end to download the full example code.
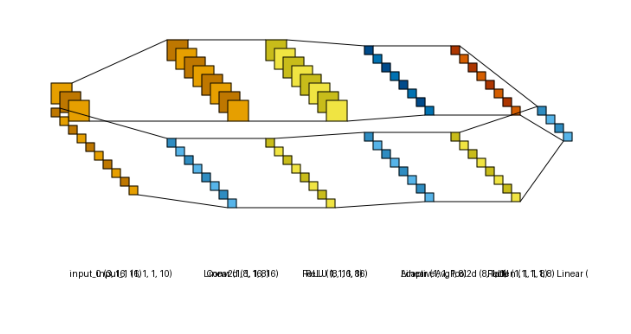
Multi-Input Model (Siamese-style)#
The same two-branch model as the graph style’s multi-input example - an image branch
(Conv2d + global pooling) and a tabular-vector branch (a small MLP) - merged by concatenation
before a shared head, rendered in lenet style instead.
Pass a tuple of per-tensor shapes as input_shape instead of a single flat shape - one shape
per positional argument of forward(), in order.
Conv2d is orange and Linear is sky blue. Shape labels are turned off here
(show_dimension=False) since parallel branches share a column, which would otherwise overlap
several labels on top of each other.
from collections import defaultdict

import matplotlib.pyplot as plt
import torch
import visualtorch
from torch import nn


class SiameseNet(nn.Module):
    """A two-branch model: an image branch and a tabular-vector branch, merged by concatenation."""

    def __init__(self) -> None:
        super().__init__()
        self.image_branch = nn.Sequential(
            nn.Conv2d(3, 8, kernel_size=3, stride=1, padding=1),
            nn.ReLU(),
            nn.AdaptiveAvgPool2d(1),
            nn.Flatten(),
        )
        self.vector_branch = nn.Sequential(
            nn.Linear(10, 8),
            nn.ReLU(),
            nn.Linear(8, 8),
            nn.ReLU(),
        )
        self.head = nn.Linear(16, 4)

    def forward(self, image: torch.Tensor, vector: torch.Tensor) -> torch.Tensor:
        """Run each branch on its own input tensor, then concatenate and project."""
        image_features = self.image_branch(image)
        vector_features = self.vector_branch(vector)
        merged = torch.cat([image_features, vector_features], dim=1)
        return self.head(merged)


model = SiameseNet()

# One shape per forward() argument: (image, vector).
input_shape = ((1, 3, 16, 16), (1, 10))

color_map: dict = defaultdict(dict)
color_map[nn.Conv2d]["fill"] = "#E69F00"
color_map[nn.Linear]["fill"] = "#56B4E9"

img = visualtorch.render(model, input_shape, style="lenet", color_map=color_map, scale_xy=1.5, show_dimension=False)

dpi = 150  # rendered at 2x this in the final doc build (savefig.dpi=300 in conf.py)
plt.figure(figsize=(img.width / dpi, img.height / dpi), dpi=dpi)
plt.imshow(img)
plt.axis("off")
plt.tight_layout()
plt.show()