
Note
Go to the end to download the full example code.
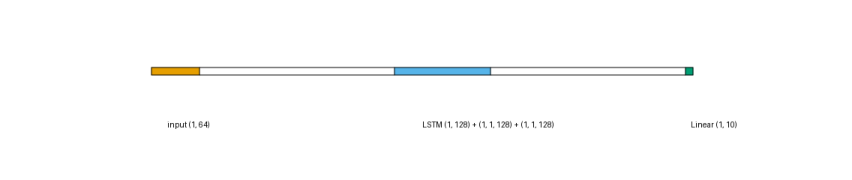
Multi-Output Layer Shapes#
A leaf layer’s forward() doesn’t always return a single tensor - nn.LSTM returns
(output, (h_n, c_n)): the full sequence of hidden states, plus the final hidden and cell
states. show_dimension defaults to True for this style, and every one of those output
tensors’ shapes is printed, not just the first, so a downstream layer that consumes h_n
instead of output (as this model does) doesn’t leave its actual input shape unaccounted for.
low_dim_orientation="x" is set here purely for a more compact, easier-to-read illustration -
the default ("z") stacks a layer’s feature count as individual depth slices, which for
hidden_size=128/64 here draws as a long diagonal chain rather than a compact block. Both
are equally valid, correct renderings of the same shapes; this is a legibility choice, the same as
this example’s spacing/padding values below.
LSTM is sky blue and Linear is bluish green.
from collections import defaultdict

import matplotlib.pyplot as plt
import torch
import visualtorch
from torch import nn


class SequenceClassifier(nn.Module):
    """A small LSTM-based classifier that reads the final hidden state, not the full sequence."""

    def __init__(self) -> None:
        super().__init__()
        self.lstm = nn.LSTM(input_size=64, hidden_size=128, batch_first=True)
        self.fc = nn.Linear(128, 10)

    def forward(self, x: torch.Tensor) -> torch.Tensor:
        """Run the LSTM, then classify from its final hidden state (h_n), not its full sequence output."""
        _output, (h_n, _c_n) = self.lstm(x)
        return self.fc(h_n.squeeze(0))


model = SequenceClassifier()

input_shape = (1, 7, 64)

color_map: dict = defaultdict(dict)
color_map[nn.LSTM]["fill"] = "#56B4E9"
color_map[nn.Linear]["fill"] = "#009E73"

img = visualtorch.render(
    model,
    input_shape,
    style="lenet",
    color_map=color_map,
    spacing=250,
    padding=60,
    low_dim_orientation="x",
)

dpi = 150  # rendered at 2x this in the final doc build (savefig.dpi=300 in conf.py)
plt.figure(figsize=(img.width / dpi, img.height / dpi), dpi=dpi)
plt.imshow(img)
plt.axis("off")
plt.tight_layout()
plt.show()